Aerobic Efficiency
Your aerobic efficiency shows how much power you produce per heartbeat. Track it over months to see whether your endurance training is actually building a stronger engine.
Last updated: Jun 2026
Your aerobic base is the engine behind everything you do on the bike. It determines how efficiently your cardiovascular system delivers power — and whether that efficiency is improving, holding steady, or declining over time.
FormBeat tracks this through Efficiency Factor (EF), measured in watts per heartbeat (W/bpm). A higher EF means you're producing more power for each heartbeat — the definition of a more efficient engine.
Why aerobic efficiency matters
Raw power numbers tell you what you can do. Aerobic efficiency tells you how your body does it.
Two riders can both hold 200 watts. One does it at 155 bpm, the other at 135 bpm. The second rider has a significantly more efficient aerobic system — and crucially, more room to push harder before hitting their limits. That's what a higher Efficiency Factor reflects.
Aerobic efficiency improves slowly — over weeks and months of consistent endurance training. It's one of the most reliable indicators that your base training is actually working, often showing progress before you see it in raw power numbers or FTP tests.
How we calculate it
Efficiency Factor = Normalized Power / Average Heart Rate
For example: 200W Normalized Power at 145 bpm average heart rate = 1.38 W/bpm.
We calculate EF for each qualifying ride, then aggregate into quality-weighted monthly averages and track the trend with linear regression over the past 6 months.
What counts as a qualifying ride
Not every ride is useful for tracking aerobic efficiency. A criterium with constant attacks or a ride with lots of stops gives unreliable EF values. We need steady, aerobic rides where your cardiovascular system is working in a consistent state:
Quality scoring
Not all qualifying rides are equally useful. A 90-minute Zone 2 ride on flat terrain with rock-steady power gives a much cleaner EF measurement than a 45-minute ride at the edge of the qualifying criteria.
Each ride receives a quality score from 0.5 (minimum criteria met) to 1.0 (ideal conditions). The score considers duration, intensity precision, variability, and decoupling. Higher-quality rides have more influence on your monthly average EF, so the trend naturally favors your cleanest data.
Understanding your trend
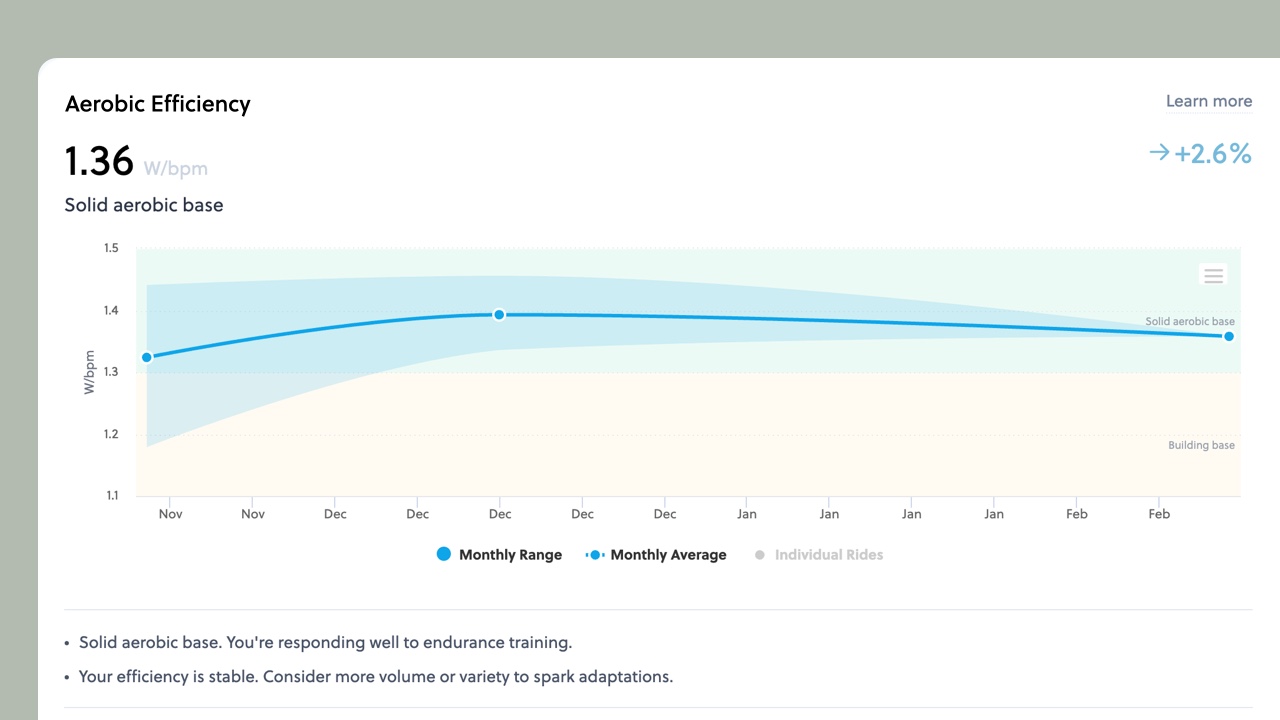
The chart shows your quality-weighted monthly average EF with a trend line fitted across the analysis window. The percentage shown is your total change over the period.
EF levels
Your current EF value is classified into a level that gives context for where you stand. These ranges are approximate — individual variation is significant, and what matters most is your personal trend over time.
Signal and confidence
The "Signal" indicator at the bottom of the card tells you how much to trust the trend. It's based on three factors:
A "low" signal doesn't mean the data is wrong — it means we need more data points to be confident about the direction. Keep riding and the signal improves naturally.
How to improve accuracy
The aerobic efficiency trend gets more reliable with better data. Here's how to give it what it needs:
Day-to-day variation is normal
Individual EF readings bounce around. Heat, humidity, hydration, caffeine, sleep, and stress all affect heart rate independently of fitness. A single ride with a high or low EF doesn't mean much on its own.
That's exactly why we track the trend across months, using quality-weighted averages. The monthly line smooths out the noise. When that line moves up over 3-6 months, you can be confident your aerobic system is genuinely improving — not just having a good day.