Power Metrics Explained
Normalized Power tells you how hard your body actually worked. Intensity Factor tells you how hard relative to your threshold. These numbers matter.
Last updated: Jun 2026
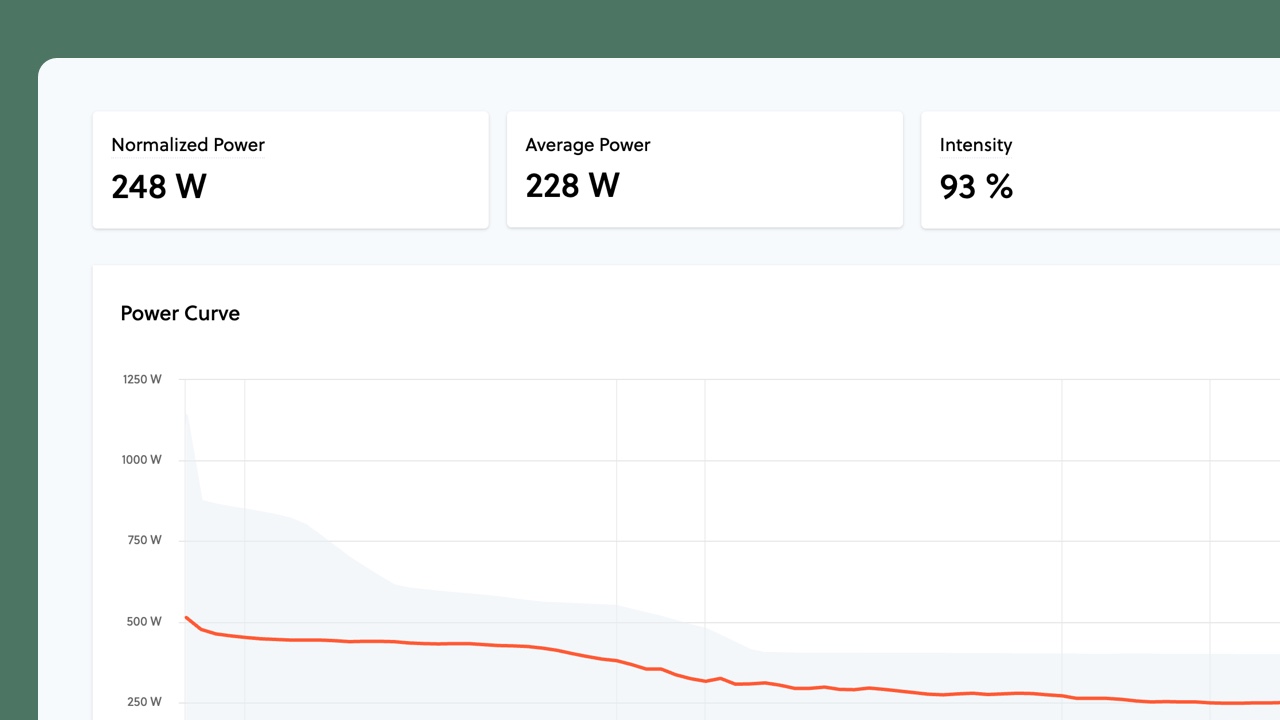
When you finish a ride, your computer shows average power. But average power can be misleading. Ride for two hours with the first hour easy and the second hour hard, and your average might look moderate — even though you're exhausted. That's where smarter metrics come in.
Normalized Power: the one that counts
Normalized Power (NP) estimates the power you would have needed to produce the same training stress at a perfectly steady effort. The idea behind it: variable effort — surging and recovering, accelerating and coasting — generally costs your body more than riding at a constant pace. A hilly ride with constant accelerations and recoveries is typically more demanding than a flat ride at the same average power.
Here's why it matters: your body responds to the stress of variable power differently than steady power. Normalized Power captures that real physiological cost. When analyzing how hard a ride actually was, NP is the number to watch.
Intensity Factor: how hard was it?
Intensity Factor (IF) is simply your Normalized Power divided by your FTP. It tells you how hard the ride was relative to what you can actually sustain.
Because IF is relative to your own threshold, it's useful for comparing the intensity of your rides against each other — a 0.85 ride is a 0.85 ride whether your FTP is 200 or 300. Just keep in mind that IF is only as accurate as your FTP setting.
Variability Index: were you steady?
Variability Index (VI) is Normalized Power divided by Average Power. A VI of 1.0 means perfectly steady effort (basically impossible outside). Under 1.05 is impressively smooth — typical of time trials or smart pacing. Above 1.1 suggests a lot of surging, common in group rides and races. Neither is inherently better, but tracking VI helps you understand the character of your efforts.
Putting it together
These metrics combine to tell the full story. Two rides with the same average power might have totally different training effects. The rider with higher NP worked harder. The rider with higher IF pushed closer to their limits. The rider with higher VI had to surge more. Understanding these nuances helps you train (and recover) smarter.
Want to calculate these yourself? Try our TSS Calculator, Intensity Factor Calculator, or Variability Index Calculator.