Analyzing Your Rides
Every ride is automatically analyzed — power zones, heart rate patterns, intensity metrics, and AI-generated insights. Dive deep when you want to, or let the summary tell you what matters.
Last updated: Jun 2026
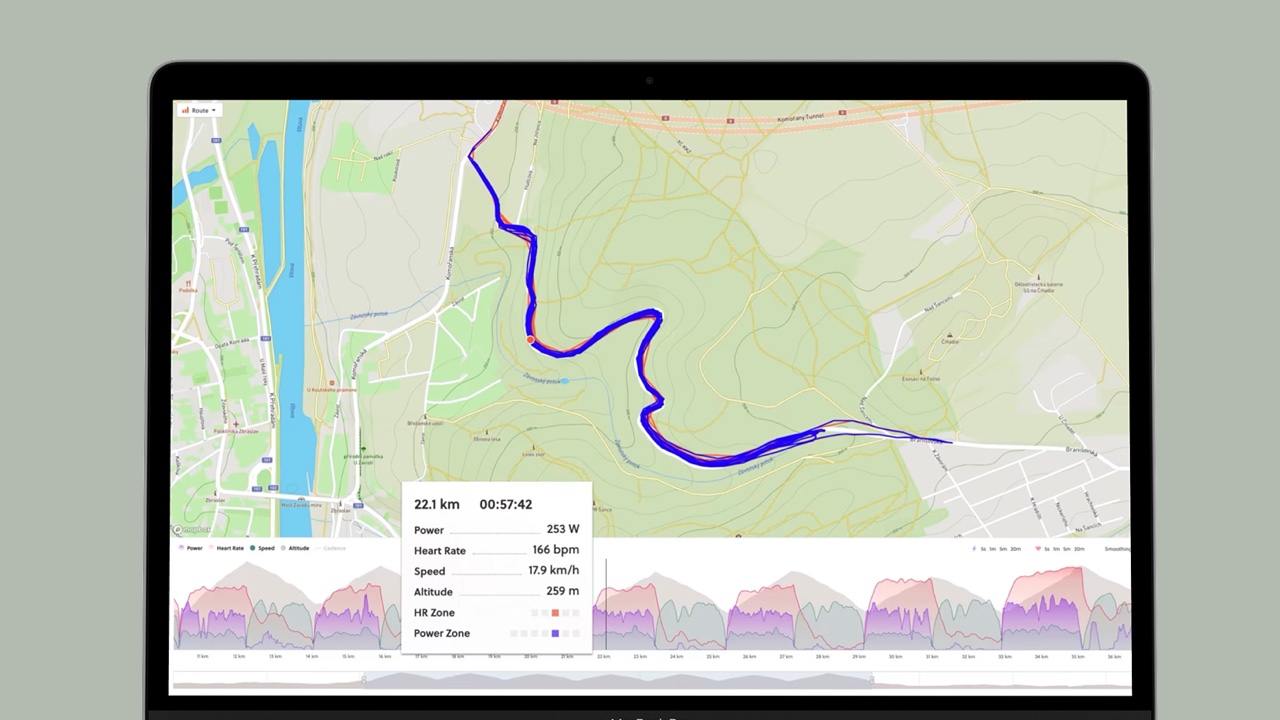
You finish a ride, sync your data, and then... what? Most cyclists stare at the numbers — average power, heart rate, distance — and try to piece together what it all means. Was this a good workout? Did I pace it right? Am I actually improving, or just accumulating miles?
FormBeat does the interpretation for you. Every ride is analyzed automatically — AI-generated insights appear on every single ride without you doing anything. This isn't a feature you have to activate or pay extra for. It's how FormBeat works.
What you'll see on every ride
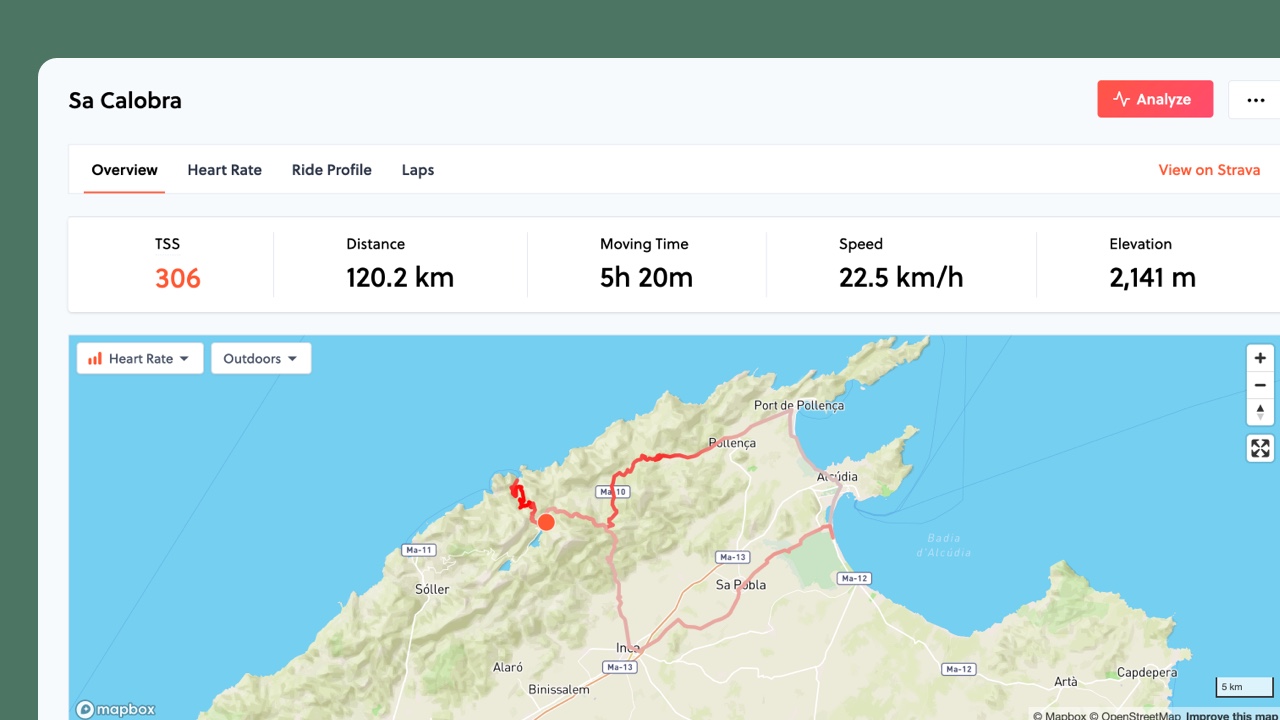
Open any activity and you'll find the essentials immediately: distance, time, elevation, average power, training stress. Your route appears on the map, and synchronized charts show power, heart rate, and elevation throughout the ride. Hover over any point on a chart and the map highlights that exact location.
Below the overview, you'll find your time in each power and heart rate zone, your power curve for this ride, and key intensity metrics — everything you'd want to know about how the effort was distributed.
The Ride Profile
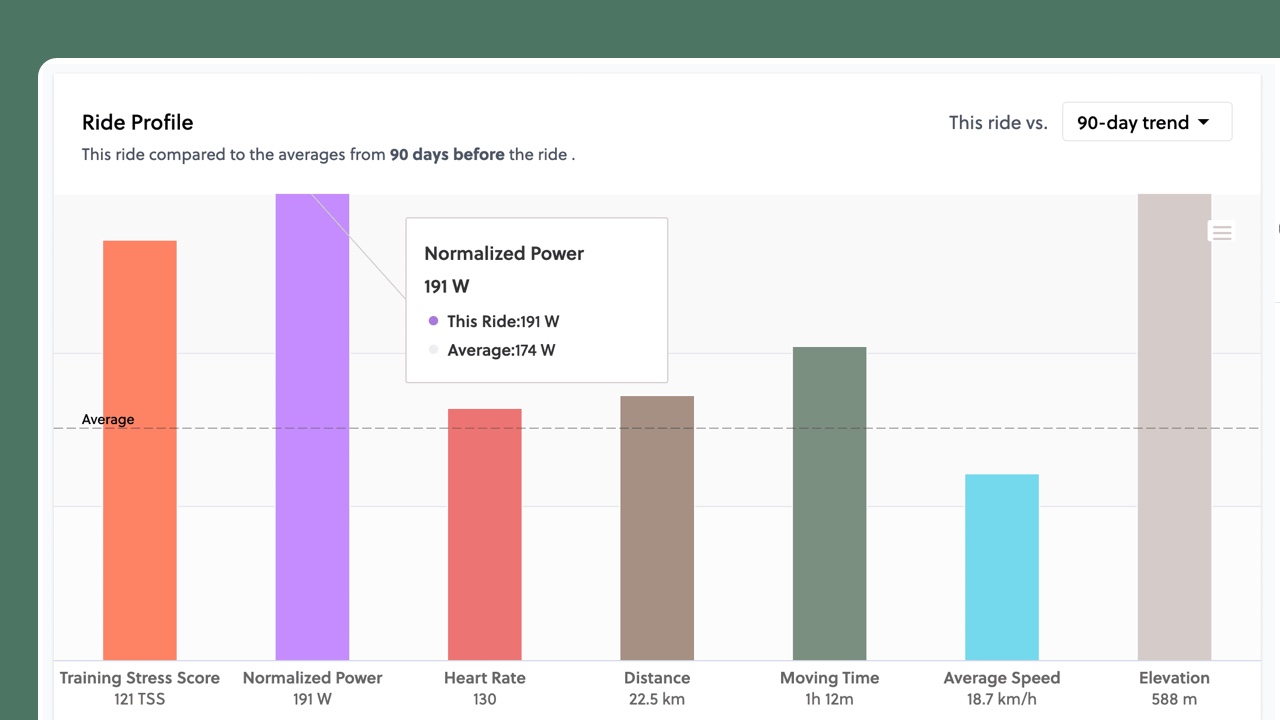
Here's something you won't find elsewhere: every ride is automatically compared to your rides from the past 90 days. The Ride Profile shows what made this ride unique — was it longer than usual? More intense? More climbing? Higher heart rate for the power? This comparison surfaces patterns you'd never notice on your own.
Going deeper: Analyze mode
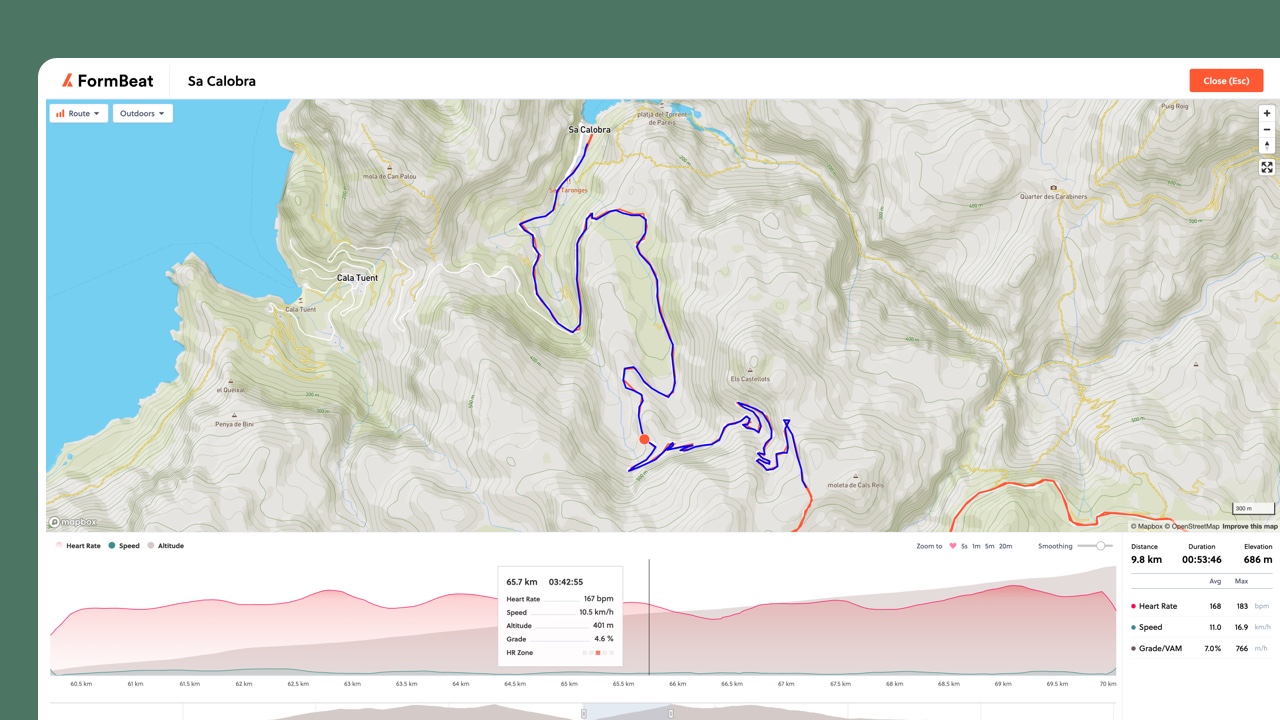
Click "Analyze" in the top right to enter full-screen analysis mode. The map expands on one side, detailed charts on the other, perfectly synchronized. This is where you can really investigate.
Jump to your peak efforts — your best 5-second, 1-minute, 5-minute, or 20-minute power — and see exactly where on the route they happened. Analyze specific segments. Smooth the data for trends or zoom into raw second-by-second detail.
Intensity metrics, variability, efficiency, and your power curve compared to recent rides.
Decoupling, zone distribution, and cardiac patterns throughout the ride.
Structured interval breakdown with per-lap metrics and comparisons.
What your ride didn't tell you
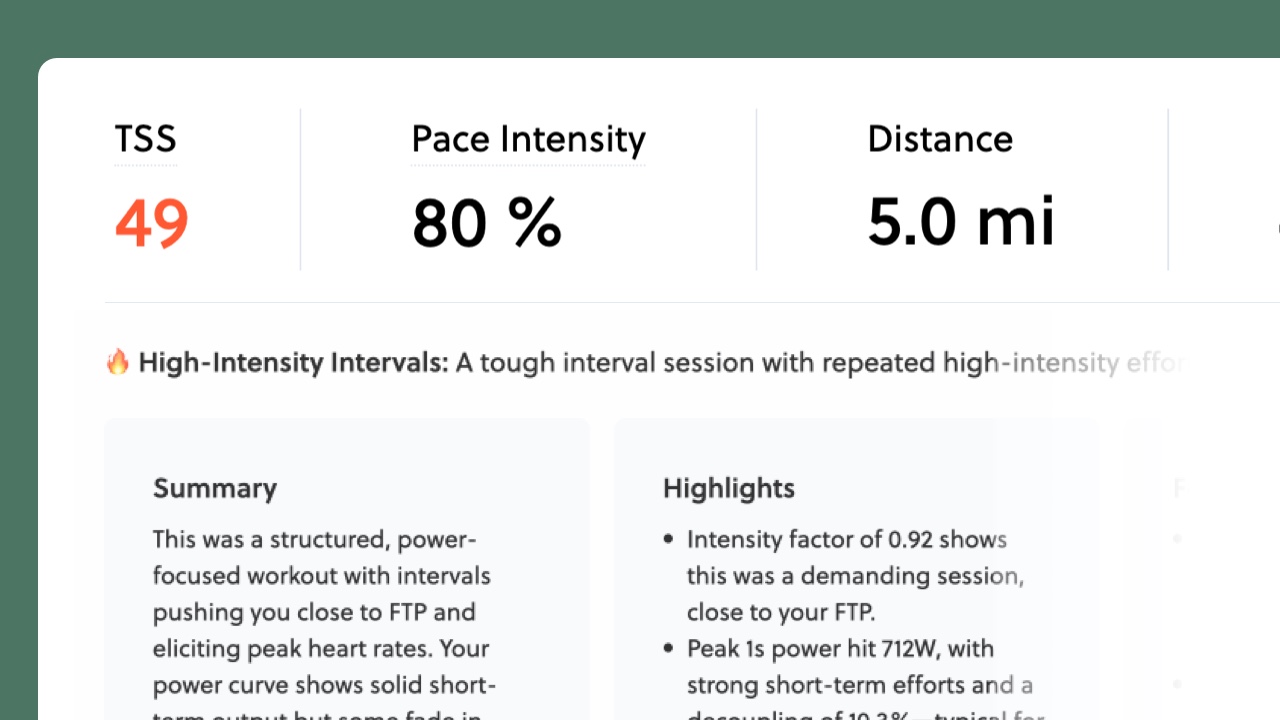
Every ride comes with AI-generated feedback — and this is where it gets interesting. The AI doesn't just describe what happened. It highlights what was good about your effort. It flags unusual patterns you might have missed. It notices when your heart rate behaved differently than expected, when your power distribution was particularly well-paced, when something in the data suggests a story worth knowing.
Think of it as the insight a coach would share after reviewing your file. Not generic praise, but specific observations: what worked, what to watch, and how to ride it better next time.
Continue the conversation

Want to dig deeper? Every ride connects directly to the AI Coach. Ask why your legs felt heavy despite modest power. Explore how this ride compares to the last time you did this route. Get context on whether this effort was appropriate given your current fatigue. The AI has your complete history, so the conversation picks up with full context — no need to explain your background.
Remember: rides are just instances
Individual rides matter, but they're moments in a larger story. A single workout can't tell you if you're improving — that takes weeks of data. A hard day when you're fatigued means something different than a hard day when you're fresh. FormBeat always shows you each ride in context, because context is where insight lives.
Analyze your rides, learn from them, then zoom back out. The bigger picture is what matters.