Is Your Training Working?
The answer depends on your phase. Building your base? Watch training load, aerobic efficiency, and distribution. Sharpening for performance? Track your power curve and peaks. Peaking for an event? Monitor your form.
Last updated: Jun 2026
You can analyze individual rides endlessly. But step back and ask the real question: is all this training actually making you faster?
That's what the dashboard is for. Not to give you more data — to answer the questions that matter. The trick is knowing which questions to ask, and that depends on where you are in your training.
The quick answer: Training Status
Every time you open FormBeat, the first thing you see is your Training Status. It's the simplest possible answer to "is this working?"
But if you want to understand why — and what to focus on — you need to look deeper. And what you look at depends on your phase.
If you're building your base
During the endurance phase, you're building your aerobic engine. Volume matters more than intensity. Consistency matters more than heroic efforts. The metrics that matter:
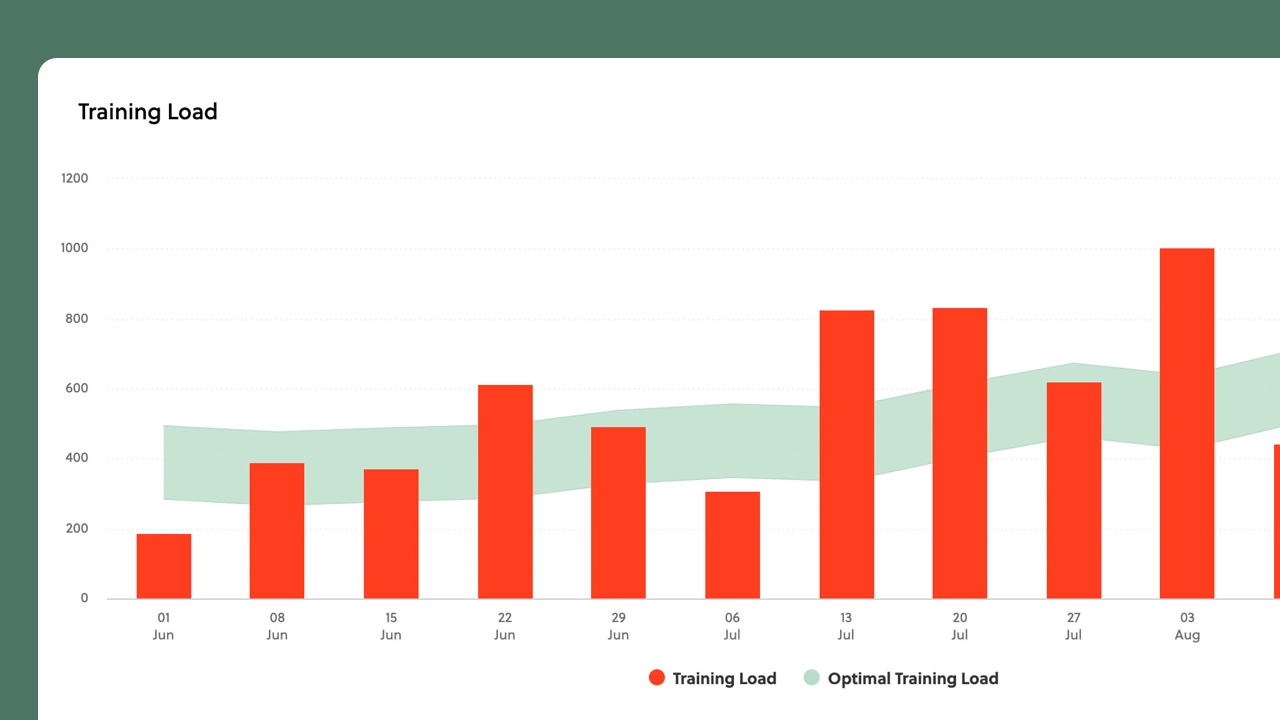
Training Load: Are you doing enough? The weekly training load chart shows your actual load against your optimal range — the band where you're building fitness without overreaching. If you're consistently below that band, you're not providing enough stimulus. If you're consistently above it, you're accumulating fatigue faster than you can absorb.
Aerobic Efficiency: Is your engine actually improving? Aerobic Efficiency (also called Efficiency Factor or EF) is your Normalized Power divided by your average heart rate. As your aerobic system develops, you produce more power at the same heart rate — or the same power at a lower heart rate. Either way, your EF goes up. One caveat: EF is also affected by heat, hydration, caffeine, and other day-to-day factors, so individual rides can bounce around. The trend over weeks and months — especially when compared across similar ride types — is where the real signal lives.
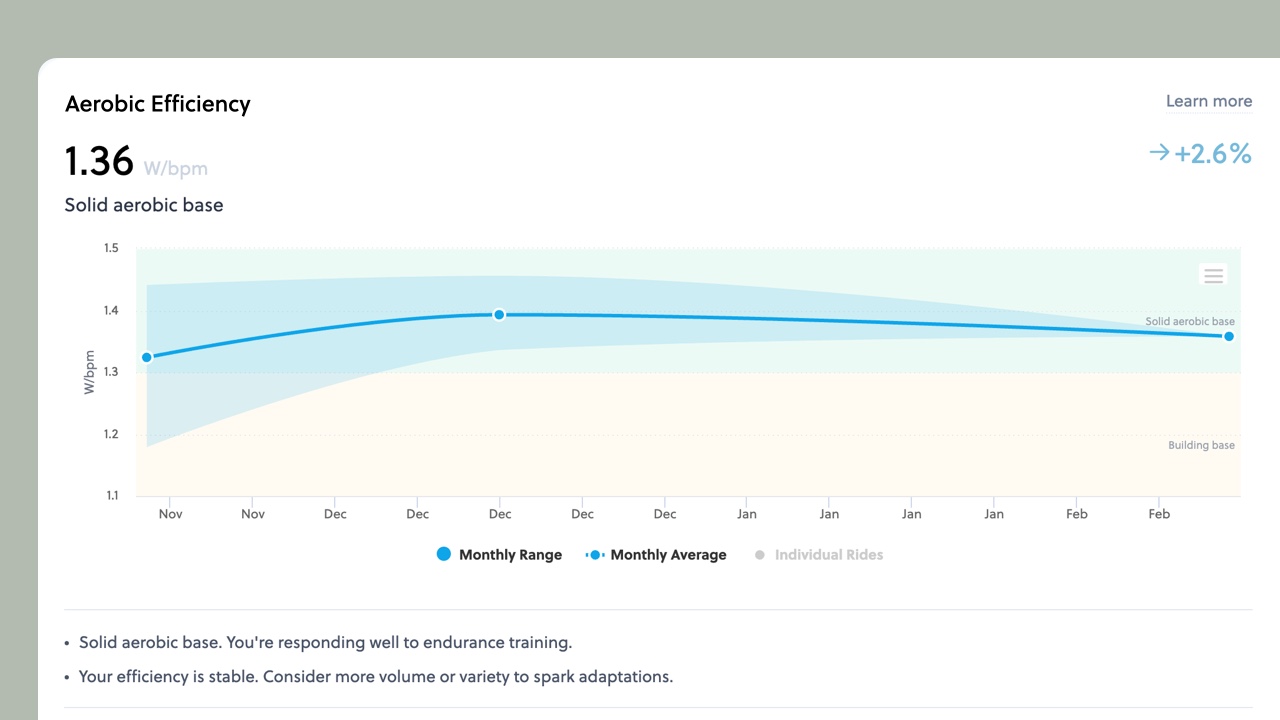
This is where Zone 2 training earns its reputation — use our Zone 2 Calculator to find your ideal zone 2 range. Long, steady rides at a conversational pace build the aerobic machinery that improves efficiency. It takes time — aerobic adaptations happen over months, not days. And while some of that base fitness is more resilient than peak sharpness, it does fade with extended time off the bike, so consistency matters. Track your Aerobic Efficiency on your dashboard — a rising line over months is a strong sign that your base building is working, even before you see it in raw power numbers.
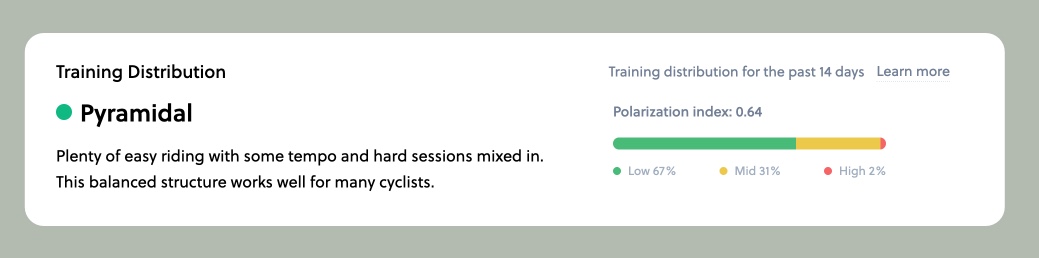
Training Distribution: How is your effort spread? Check your polarization index. Many successful endurance athletes show a pattern of mostly low-intensity training with focused high-intensity sessions — and relatively little time in the moderate zone. If most of your riding lands in the middle, you may not be recovering enough on easy days to go truly hard on hard days. The polarization index helps you see this pattern over time.
If you're sharpening for performance
Once your base is built, the focus shifts to intensity. You're not just building endurance anymore — you're building speed, power, and the ability to go hard when it counts. Different metrics matter now:
Power Curve: Are you faster at the durations that matter? Your power curve shows your best power at every duration from 5 seconds to an hour. Compare your current curve to your all-time bests. If the curve is rising at the durations you care about — whether that's 1-minute attacks, 5-minute climbs, or 20-minute time trials — you're getting faster where it counts.
Power Peaks: Where are your recent records? Check your achievements and power records. Are you setting new bests at key durations? Even small improvements — 5 watts here, 10 watts there — add up over a season.
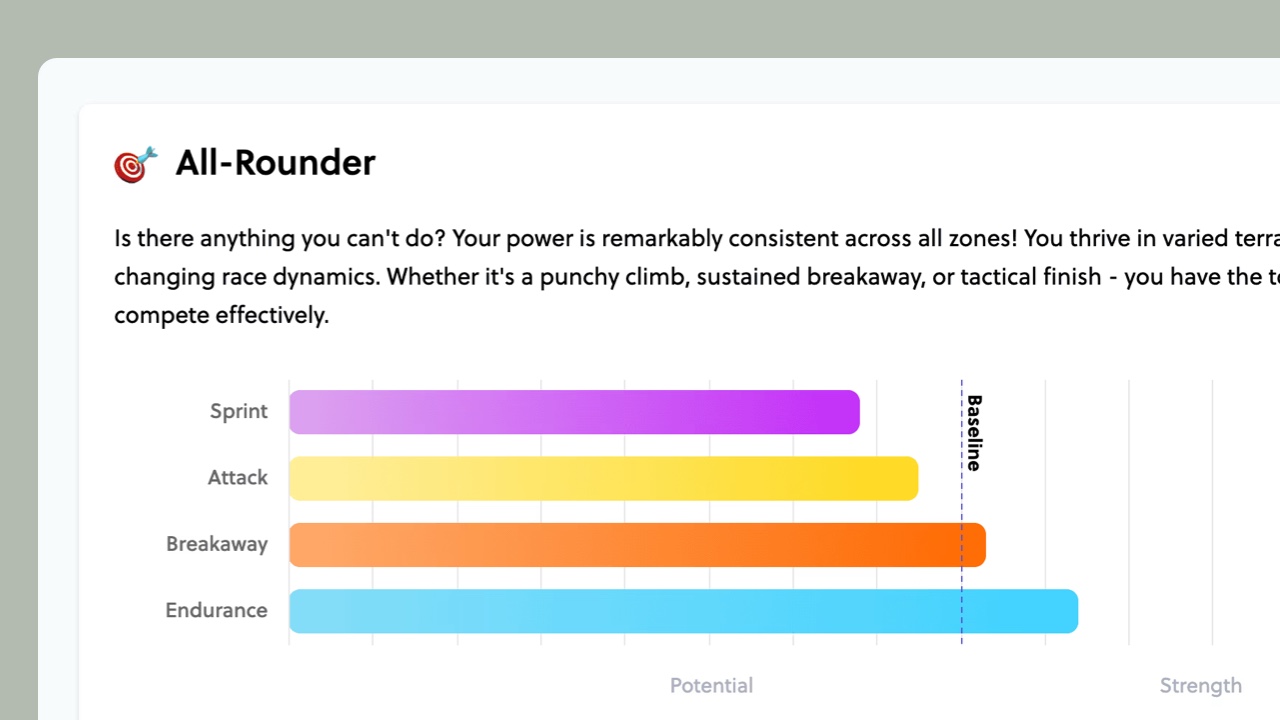
Athlete Profile: What kind of rider are you becoming? Your power profile shows your strengths across sprint, anaerobic, VO2max, and threshold durations. As you train, this profile shifts. If you've been targeting 5-minute power, you should see that slice of the pie growing.
If you're peaking for an event
You have a target date. The work is done — now it's about arriving fresh without losing the fitness you've built. One metric dominates:
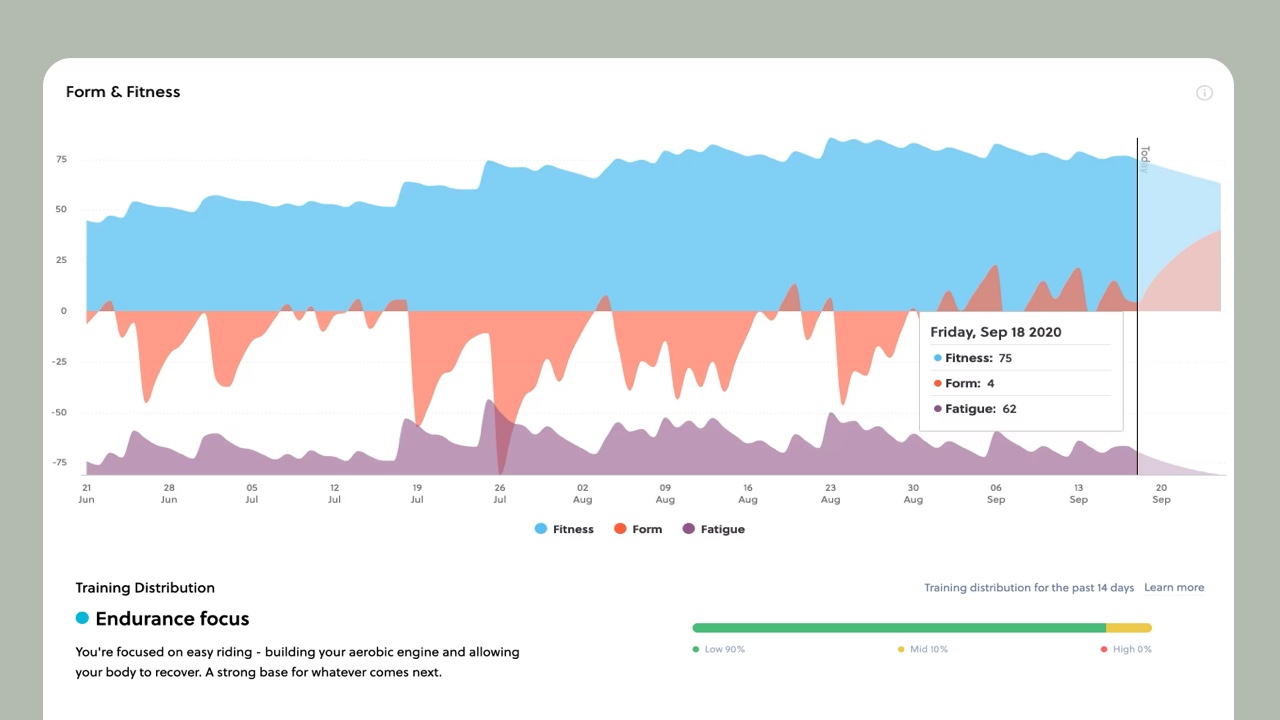
Form: Are you fresh enough? In the final days before an event, watch your form climb into positive territory. The exact number that works best varies from person to person — some athletes race well just barely positive, others need more rest. Over time, you'll learn your own sweet spot by noticing how you feel and perform at different form values.
Form Predictions: Will you be ready? The form chart extends into the future, showing where you're heading if training continues at its current rate. Use this to plan your taper. If predictions show you'll be at -5 on race day, you need more rest. If they show +30, you might be resting too much.
The weekly check-in
You don't need to analyze everything every day. Most of these metrics move slowly — fitness builds over weeks, efficiency improves over months. Check the dashboard weekly. Look at trends, not daily fluctuations.
Ask yourself: Based on my phase, what should I be watching? Then watch it. The answers are there — you just have to know which questions to ask.