
What is Maximum Power
Maximum Power
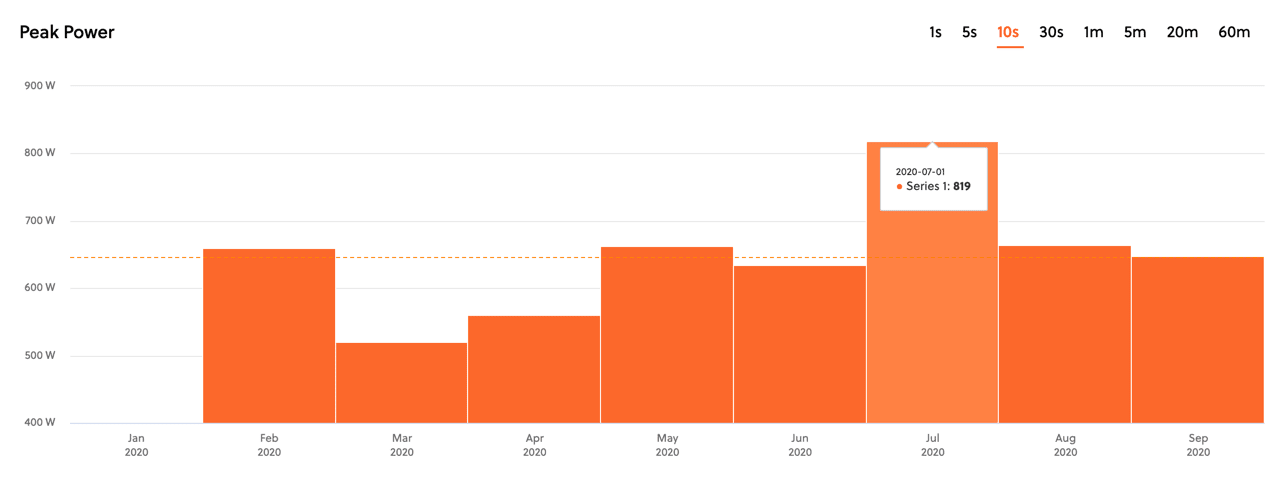
Maximum power output represents the highest average power in watts you can sustain for a given duration.
Our Peak Power chart will help you understand improvements to your maximum power output for time periods of one second to one hour. This chart is complementary to the Power Curve chart, but it allows you to see the variability and improvement of your maximum power at a given breakpoint over time.
You can display and analyze your maximum power output for various periods (e.g. Past 30 days, This Year, All Time) and segment it by day, week, month or year.
Sign up
to start tracking your
Maximum Power
.

© 2026, FormBeat.
Terms of Use
,
Privacy Policy
AI powered by
Voilà
NP®, IF® and TSS® are trademarks of
Peaksware, LLC